 Click the map to create your own at 270toWin.com

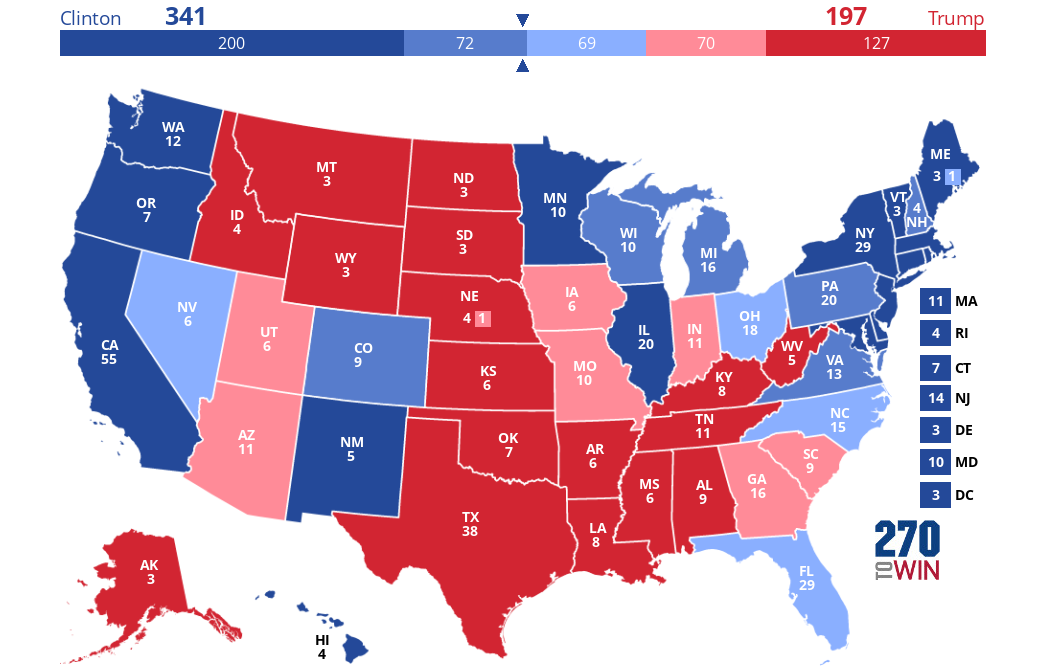
The above images give you a fairly decent snapshot of where the 2016 race for President stands as of Labor Day. Clinton's probability of winning--depending on which forecast model you use--varies from 70% to 93%. The race has tightened a bit since Clinton's post-convention polling bounce, but she remains overall a very strong favorite to win. (Clinton currently leads by 5% on average.) She has an especially strong edge in swing states though her starting point is already above the 270 Electoral Votes needed to win. There is some disagreement in the forecasting world about just how strong a favorite she is. Almost everyone agrees she is the likely winner, but a 20% spread in chances for Trump is pretty big. Does he have a very tiny chance or is he a more modest-but-still-underdog? I'd explain this variation, mostly, as a disagreement over whether her actual lead is closer to 4-5% (Obama levels) or something larger like the 15% landslide numbers we saw earlier. And that's mostly uncertainty about turnout. Trump has a fairly steady base of support that he neither goes lower or higher than. Clinton, on the other hand, gains and loses support depending on a number of factors including Republicans who cross party lines, 3rd party voters, and minority voters who actually show up to vote.
--In the first map, Hillary Clinton's likely winning states are in various shades of blue. Trump states are in red. This is my best guess for the way states will end up voting given recent polling, history, etc.. The various shades of blue go from darkest blue being almost certain Clinton state to lighter blue being the weakest lead for Clinton.
--The second graphic is the distribution of all possible Electoral College outcomes, via Princeton Election Consortium, with the dark blue as the most-likely. The statistical "tails" are outlying possibilities that are very unlikely. Notice there is almost no Electoral College outcome where Trump reaches 270 and that 300 Electoral Votes is a near sure-thing for Clinton. The largest probability is 340 Electoral Votes which is in line with the map I've created. (More about variation in a minute.)
--The third graph is the line of median Electoral Votes, also from PEC, and how it has shifted over time. The horizontal red line represents the winning total of 270 EV. The red cone represents where the most-likely outcome in the Electoral College is headed between now and November. The yellow "tails" are still-possible but unlikely outcomes. Think of the difference in these two as being about confidence. We're fairly confident the result will end up in the red zone. But yellow is within the "it could happen" range. We'd be surprised, but it's not impossible.
The real trouble in forecasting at the moment is that quite a few states are very close even though they may not affect who wins. Think here of Georgia, Arizona, or even Mississippi. States that will probably go Trump, but Democrats have a very small chance of picking off. The same can be said of states like Ohio, Nevada, and Florida for Democrats...they all lean blue, but Trump has a chance here even if sweeping them would still put him behind in the Electoral College. Iowa has been especially tricky...an Obama state where Clinton just beat Sanders in the primary. But the race is looking close against Trump even if those Electoral Votes are probably not important in the overall picture. I put it in the Trump camp. But, on the other hand, if Election Night looks more like a landslide for Clinton it would shift blue like the rest of these questionable states. FiveThirtyEight has done some nice work about what popular vote percent you can expect a state to flip one direction or the other.
Moving on to the Senate and House, there have been a few shakeups such as in Indiana that have tipped the already-difficult map for Republicans even more towards Democrats. Right now, the two most-likely outcomes are Democrats with either 50 or 51 seats. 50 seats would technically be a tie but would go to Democrats if the Vice President can break the tie. Chances they control the Senate are around 75%, currently.
For both the Senate and House, the biggest uncertainty is "ticket splitting." That's when a voter picks a Presidential candidate from one party and down ballot choices are for a different party. It's been on the decline in recent years, but there is some thought out there that Trump may lose the White House vote but send Republicans scrambling to cover Congress down the line to prevent total losses.
In the House, Clinton would need to win by about 8% to make up for the gerrymandering that favors Republicans. This was entirely plausible a few weeks ago, but is looking less likely as Clinton has slipped down to a 5% lead.
Conclusion: Hillary Clinton is a near certain winner for President though the margin of victory remains uncertain. The Senate is likely to switch hands to Democrats, especially with Clinton in the White House. But the House of Representatives is probably a tall task for Democrats. In the event of a Hillary landslide (which I would rank as possible but not likely), Congressional control may go to Democrats. I envision the most-likely scenario as a split though. At the moment, for Election night, I would predict a 5% Clinton win as generating 340 EV. In the event her margin is closer to 10%, the chances of Democrats re-taking the House goes up.